- Understand PE manifest
- Practice analyzing function call parameters and stack
- Operating Systems
- Assembly Language
In this tutorial, we show you how Max++ retrieves an "instance specific" decoding key from the PE manifest. By planting a decoding key into the PE manifest, the malware can first distinguish a copy from the other so that it can trace which copy sits on which machine (thus tagging an ID to each victim and can even potentially trace back to malware analyst if the copy is being debugged). One more popular use of it would be making each copy of the binary executable significantly different from each other, thus making a much harder job for virus detectors to define virus signatures.
We will also practice how to analyze the parameters of a function call and the use of MSDN documentation and other relevant online resources to reverse engineer binary code.
2. Lab Configuration
(0) Start WinXP image in DEBUGGED mode. Now in your host system, start a windows command window and CD to "c:\Program Files\Debugging Tools for Windows (x86)" (where WinDBG is installed). Type "windbg -b -k com:pipe,port=\\.\pipe\com_12" (check the com port number in your VBox instance set up). When WinDbg initiates, types "g" (go) twice to let it continue.
(1) Now launch IMM in the WinXP instance, clear all breakpoints and hardware breakpoints in IMM (see View->Breakpoints and View->Hardware Breakpoints).
(2) Go to 0x4012DC and set a hardware breakpoint there. (why not software bp? Because that region will be self-extracted and overwritten and the software BP will be lost). Pay special attention that once you go to 0x4012DC, directly right click on the line to set hardware BP (currently it's gibberish code).
(3) PressF9 several times run to 0x4012DC. You will encounter several breakpoints before 0x4012DC. If you pay attention, they are actually caused by the int 2d tricks (explained in Tutorial 3 and 4, and 5). Simply ignore then and continue (using F9) until you hit 0x4012DC.
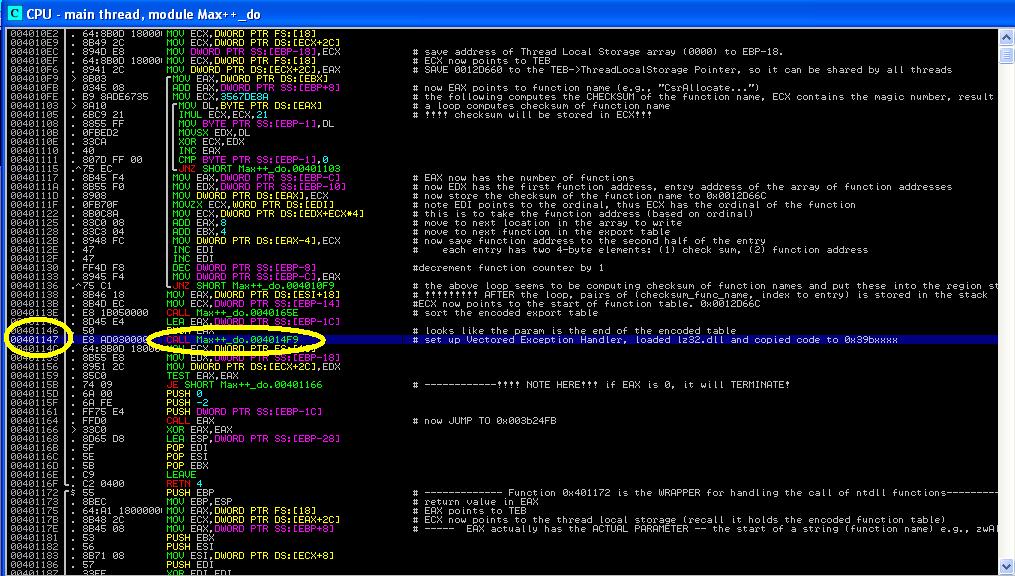
Figure 1 shows the code that should be able to see. As you can see, this is right before the call of RtlAddVectoredException, where hardware BP is set to break the LdrLoadDll call (see Tutorial 11 for details). At this point, the code at 0x3C24FB has not been extracted. If you go to 0x3C24FB at this moment, IMM will complain that this address is not accessible.
 |
| Figure 1: code at 0x4012DC |
 |
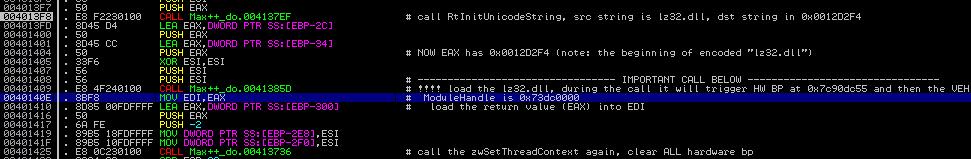
| Figure 2: code at 0x401407 |
(6) Now we will set a breakpoint at 0x3C24FB. Goto 0x3C24FB and set a SOFTWARE BREAKPOINT there. Press SHIFT+F9 to run to 0x3C24FB.
(Figure 3 shows the code that you should be able to see. The first instruction at 0x3C24FB should be CMP DWORD PTR SS:[ESP+8], -2. You will notice that [ESP+8] is currently -2, and the execution will reach the instruction CALL 0x003C23DB. Press F7 to step into function 0x003C23DB.
 |
| Figure 3: code at 0x3C24FB |
3. Background Introduction: Function 0x003C23DB
The function body of 0x003C23DB is shown in Figure 4. If you look at the comments of the code pane, you might notice that this function is doing a lot of malicious actions. It first retrieve a self-decoding key from the PE manifest. Then it injects a thread into a currently running process and sets a timer, which kills the Max++.exe 10 seconds after the process is terminated. It then infects a number of important system libraries such as ntdll.dll and also randomly picks a system driver to infect. It is not possible to cover all the malicious actions of function 0x003C23DB in one tutorial. We concentrate on the function call at 0x3C23FE (reads decoding key)
 |
| Figure 4: The Malicious Actions |
4. RtlAdjustPrivilege at 0x3C23F3.
Let's first study the instruction "CALL DS:[3D10E8]" at 0x3C23F3 (as shown in Figure 4 and Figure 5). Note that before the call of the entry function by Max++ itself, it has properly set up the DS register. So when the execution comes to 0x003C23F3, the value of DS + 0X3D10E8 is the entry address of the ntdll.RtlAdjustPrivilege function. IMM is smart enough to show the hint in the comments area, which is very nice (see Figure 2). Our job is to try to figure out, what is the semantics of all the parameters of this call. Doing a simple Google search of RtlAdjustPrivilege (again, please do the search in the VBox instance to avoid potential drive-by-download attack) leads us to the documentation such as [1] and [2]. We soon learn that the RtlAdjustPrivilege function has four parameters:
(1)ULONG Privilege
(2) BOOLEAN Enable
(3) BOOLEAN CurrentThread
(4) OUT Boolean Enabled
Then the question is: what are the corresponding values in the stack?
Now look at the stack contents in Figure 5. You can immediately infer that 0x14 is the Privilege, Enable value is 0x1 (true), CurrentThread is 0x0, and ENABLED value is 0x12D623 (why? because the output value will be stored at that address -- to verify this, read the source code at line 00174 of [2] ).
Challenge 1: What does the value 0 mean for CurrentThread? [hint: you have to read the source code in [2])
Now the most intriguing part to us is: what is the semantics of 0x14 for Privilege? We have to blame the macro definition of constants of the C language (what if the WINNT designers have used enumerated types, that makes our job much easier!) If you read [1] carefully, you will notice that it's the SeDebug privilege. [note: the decimal value of 0x14 is 20].
Why does Max++ need the SeDebug privilege? If you read the explanation in [1], you will notice that once a process has SeDebug, it is able to open any other process in the system, which is perfect for accomplishing the jobs like injecting another thread into a currently running process (see Figure 1 in Section 3).
 |
| Figure 5: RtlAdjustPrivilege |
Section 5. Analysis of the Function call at 0x3C23FE (CALL lz32.003C1129)
Now, let's delve into the function call at 0x3C23FE (see Figure 4). F7 to step into it,
Figure 7 shows the function body of 0x003C1129. It gives you the general idea of what this function is doing.
There are several important calls: at 0x003C1131, it calls getModuleHandleW to get the handle of the current process, and then at 0x3C1145 it calls LdrFindResource_U to find some resources related to this process, and then at 0x3C1159, it calls LdrAccessResource. At 0x003C116B it calls strstr (to search for a string "<description>"). Then it takes out the decode-key "11001800" and saves it to somewhere in the stack at 0x003C1185.
 |
| Figure 7: Function body of 0x003C1129 |
Challenge 2.Explain the semantics of the parameters of all system calls in the function body (e.g., getModuleHandleW and LdrAccessResource).
Challenge 3. Explain how is the decoding key "11001800" taken out?
Challenge 4***. Can you find out how is "11001800" used in the later code of Max++? (hint: use Data breakpoint).
References
1. "Topic: Tip: Easy way to enable privileges", available at http://forum.sysinternals.com/tip-easy-way-to-enable-privileges_topic15745.html
2. ReactOS Doxygen, "RtlAdjustPrivilege source code", available at http://doxygen.reactos.org/d9/db7/lib_2rtl_2security_8c_a1cf697d376343212dfa89ac97b0c30d8.html