Learning Goals:
- Explore the behavior difference of debuggers on int 2dh.
- Debugging and modification of binary executable programs.
- Basic control flow constructs in x86 assembly.
Applicable to:
- Computer Architecture
- Operating Systems
- Operating Systems Security
- Software Engineering
Challenge of the Day:
- Find out as many ways as possible to make a program run differently in a debugged environment from a regular execution (using int 2d)?
1. Introduction
The behavior of int 2d instructions may be affected by many factors, e.g., the SEH handler installed by the program itself, whether the program is running under a ring 3 debugger, whether the OS is running in the debugged mode, the program logic of the OS exception handler (KiDispatch), the value of registers when int 2d is requested (determining the service that is requested).
In the following, we use an experimental approach to explore the possible ways to make a program behave differently when running in a virtual machine and debugged environment.
2. Lab Configuration
In addition the the immunity debugger, we are going to use WinDbg in this tutorial. Before we proceed, we need to configure it properly on the host machine and the guest XP.
If you have not installed the guest VM, please follow the instructions of
Tutorial 1. Pay special attention to Seciton 3.1 (how to set up the serial port of the XP Guest). In the following we assume that the pipe path on the
host machine is
\\.\pipe\com_11 and the
guest OS is using
COM1. The installation of WinDbg on the host machine can follow the instructions on
MSDN.
We need to further configure the XP guest to make it work.
(1) Revision of c:\boot.ini. This is to set up a second booting option for the debug mode. The file is shown as below, you can modify yours correspondingly. Note that we set COM1 as the debug port.
-------------------------------------
[boot loader]
timeout=30
default=multi(0)disk(0)rdisk(0)partition(1)\WINDOWS
[operating systems]
multi(0)disk(0)rdisk(0)partition(1)\WINDOWS="Microsoft Windows XP Professional" /noexecute=optin /fastdetect
multi(0)disk(0)rdisk(0)partition(1)\WINDOWS="DEBUGGED VERSION" /noexecute=optin /fastdetect /debug /debugport=com1 /baudrate=115200
------------------------------------
(2) Manual configuration of COM ports. In some versions of XP, COM ports have to be manually configured. You can follow jorgensen's tutorial on "
How to Add a Serial Port in Windows XP and 7 Guest" (follow the XP part). It consists of two steps: (1) manually add a COM port in Control Panel and (2) manually configure COM1 as the port number.
(3) Test run of WinDbg.
Start your
XP guest in the
debug mode (2nd option).
Now in the
host machine, launch the "Windows SDK 7.1" command window coming with WinDbg. Change directory to "c:\Program Files\Debugging Tools for Windows(x86)" and type the following. You should be able to get a window as shown in Figure 1.
windbg -b -k com:pipe,port=\\.\pipe\com_11
You might notice that currently you are not able to access your XP Guest. This is because WinDbg stops its running, Simply type "
g" (standing for "go") in the WinDbg window, and let the XP Guest continue.
 |
| Figure 1: Screenshot of WinDbg |
3. Experiment 1: Int 2d on Cygwin
In the following, we demonstrate some of the interesting behaviors of Int 2d using a simple program Int2dPrint.exe. The C++ source of the program is shown in the following. The output of the program should be "AAAABBBB". We added a fflush(stdout) to enforce the output in an eager mode and before each printf() statement, there are
five integer operations to allow us insert additional machine code later.
----------------------------------------------
#include <stdio.h>
int main(){
int a = 0;
int b = 0;
int c = 0;
int d = 0;
int e = 0;
printf("AAAA");
fflush(stdout);
a = 0; b = 0; c = 0; d = 0; e = 0;
printf("BBBB");
fflush(stdout);
}
--------------------------------------------
Source code of Int2dPrint.exe
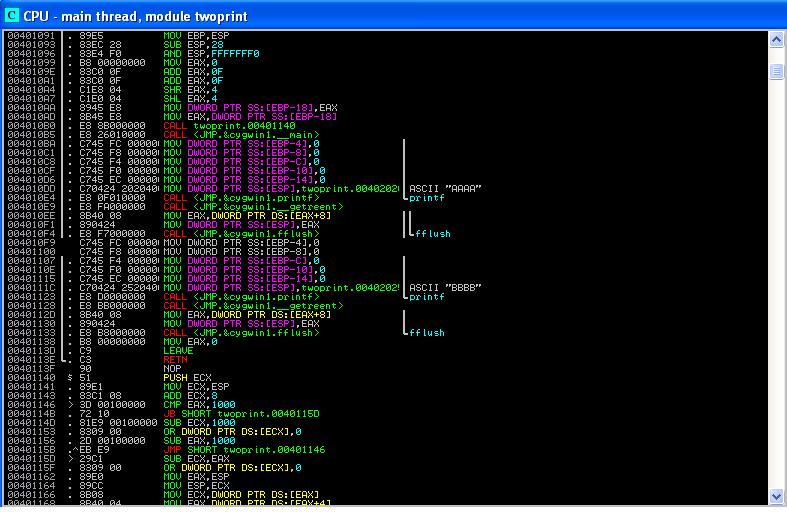
Figure 2 shows the assembly of the compiled code.Clearly,the 'MOV [EBP-xx], 0' instructions between 0x4010BA and 0x4010D6 correspond to the integer assignments "int a=0" etc. in the source program. The "MOV [ESP], 0X402020" at 0x4010DD is to push the parameter (the starting address of constant string "AAAA") into the stack, for the printf() call. Also note that before the fflush call at 0x4010F4, the program calls cygwin.__getreent. It is to get the thread specific re-entrant structure so that the stdout (file descriptor of the standard output) can be retrieved. In fact, you can infer that the stdout is located at offset 0x8 of the reentrant structure.
 |
| Figure 2. Compiled Binary of Int2dPrint.cc |
3.1 Patching Binary Code
Now let us roll our sleeves and prepare the patch the Int2dPrint.exe. The binary program is compiled using g++ under Cygwin. To run it, you need the cygwin1.dll in Cygwin's bin folder. You can choose to compile it by yourself, or use the one provided in the zipped project folder.
Make sure that your XP guest is
running in NON-DEBUG mode!
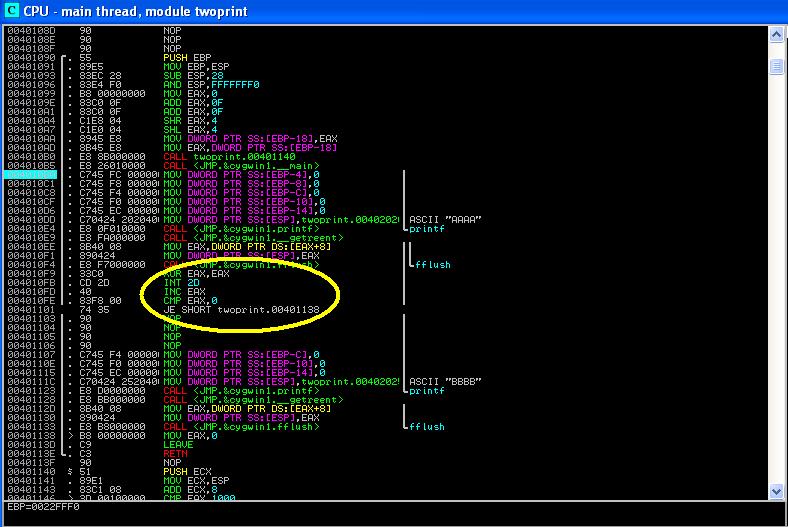
We now add the following assembly code at location 0x4010F9 of Int2dPrint.exe (the first "int a=0" before the printf("BBBB")). Intuitively, the code tests the value of EAX after the int 2d call. If EAX is 0 (here "JZ" means Jump if Zero), the program will jump to 0x401138, which skips the printf("BBBB").
Notice that this occurs only when the instruction "inc EAX" is skipped.
------------------------------------
xor EAX, EAX # set EAX=0;
int 2d # invoke the exception handler
inc EAX # if executed, will set EAX=1
cmp EAX, 0
JZ 0x401138 # if EAX=0, will skip printf("BBBB");
-----------------------------------
The assemble Code to Insert
The following shows you how to patch the code using IMM:
(1) Right click at 0x4010F9 in the CPU pane, and choose "
Assemble". (Or simple press Spacebar at the location). Enter the code as above.
(2) Right click in the CPU pane, choose "
Copy to Executable" --> "
All Modified", then click "
Copy All". A window of modified instructions will show up. Close that window and click "Yes" to save. Save the file as
Int2dPrint_EAX_0_JZ0.exe. The name suggests that the EAX input parameter to the int 2d service is 0, and we expect it to skip the printf("BBBB") if EAX=0, i.e., the output of the program should be "AAAA". (this, of course, depends on whether the "inc EAX" instruction is executed or not).
In Figure 3, you can find the disassembly of
Int2dPrint_EAX_0_JZ0.exe. Setting a breakpoint at 0x004010BA, you can execute the program step by step in IMM. You might find that the output is "AAAA" (i.e., "BBBB" is skipped). It seems to confirm the conclusion of byte scission of int 2d.You can also run the program in a command window, the output is the same.
 |
| Figure 3. Disassembly of Int2dPrint_EAX_0_JZ0.exe |
But wait, how about another experiment. Let's modify the instruction at 0x401101 and make it "
JNZ 0x401138" (name it as
Int2dPrint_EAX_0_JNZ0.exe). What is the expected output? "AAAABBBB"?
You might find that in IMM, the program outputs "AAAABBBB"; but if run in command window, it generates "AAAA" only!!! (Notice that we have ruled out the possibility that the I/O output was lost in buffer - because we call the fflush(stdout) to enforce all outout immediately). What does this mean? There could be two possibilities:
(1). Somehow, the instruction "INC EAX" is mysteriously executed (in the regular execution of Int2dPrint_EAX_0_JNZ0.exe). This makes no sense, because prior to 0x401101, the program is exactly the same as Int2dPrint_EAX_0_JZ0.exe.
(2). There is something tricky in the exception handler code (it could be the SEH of the program itself, or the KiDispatch in the kernel).
We will later come back to this strange behavior, and provide an explanation.
3.2 Experiments with Kernel-Debugging Mode
Now let's
reboot the guest OS into the DEBUG mode (but
without launching WinDbg in the host machine). Let's re-run the two programs, you might have some interesting finding.
Both programs hang the guest OS!
Now let's reboot the guest OS again into the DEBUG mode and launch WinDbg in the host machine (press "g" twice to let it continue). Now start the Int2dPrint_EAX_0_JNZ0.exe in command window. What is your observation? Figure 4 displays the result: the debugger stops at 0x4010fd (the "inc EAX" instruction) on exception 80000003 (the exception code "BREAKPOINT" in windows)! If you type "g", the program will proceed and
produce "AAAA"! (
while in the non-debugged windows mode and command window, it's producing "AAAABBBB"!)
 |
| Figure 4: Running Result of Int2dPrint_EAX_0_JNZ0.exe |
3.2 Discussion
Now let us summarize our observations so far in Table 1 (I did not discuss some of the experiments here but you can repeat them using the files provided).
 |
| Table 1: Summary of Experiment 1 |
To simply put:
int 2dh is a much more powerful technique to examine the existence of debuggers than people previously thought (see the reference list of
tutorial 3). It can be used to detect the existence of both ring 3 (user level) and ring 0 (kernel level) debuggers. For example, using Table 1, we can easily tell if Windows is running in DEBUG mode (i.e., kernel debugger enabled) or not, and if a kernel debugger like WinDbg is hooked to the debug COM port or not. We can also tell the existence of a user level debugger such as IMM, whether windows is running in non-debug or debug mode. The delicacy is that the final output of the int 2dh instruction is affected by many factors, and experiment 1 only covers a subset of them. The following is a re-cap of some of the important facts:
- EAX, ECX, EDX are the parameters to the int 2d service. EAX (1,2,3,4) represent the printing, interactive prompt, load image, unload image. See Almeida's tutorial for more details.Notice that we are supplying an EAX value 0, which is not expected by the service! (normal values should be from 1 to 4).
- Once the int 2d instruction is executed, CPU locates the interrupt vector and jumps to the handler routine, which is the part of OS.
- OS wraps the details of hardware exception, and generates kernel data structures such as Exception_Record, which contains Exception Code: 80000003 (represents a breakpoint exception).
- Then control is forwarded to kernel call KiDispatchException, which depending on if Windows is running in kernel mode, exhibits very sophisticated behavior. See details in G. Nebbett, "Windows NT/2000 Native API Reference" (pp 441 gives pseudo code of KiDispatchException). For example, in windows debug mode, this generally involves forwarding the exception to debugger first (calling DbgkForwardException), and then the invocation of user program installed SEH handlers, and then forward the exception to debugger a second time.
We now proceed to briefly explain all the behaviors that we have observed.
Case 1. Non-Debug Mode and Command Window (column 2 in Table 1): this is the only case that Int2dPrint_EAX_0_JZ0.exe and Int2dPrint_EAX_0_JNZ0.exe behave
the same way. There is only one explanation: the inc EAX is not executed - not because the exception handling behaves differently in a debugged environment, but because
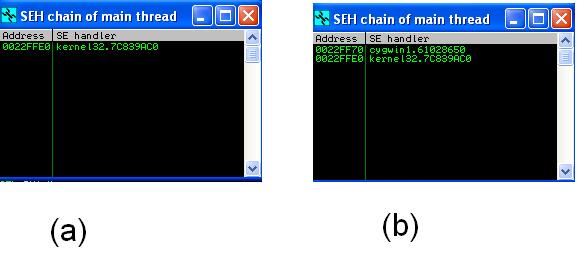
the entire process is terminated. To illustrate the point, observe the two screenshots in Figure 5, which are generated by the IMM debugger via (
View->SEH Chain). Diagram (a) shows the SEH chain when the program is just started, you can see that the default handler kernel32.7C839AC0 (means the entry address of the handler is 7c839ac0 and it is located in kernel32). If you set a breakpoint right before the printf(), you might notice that the SEH chain now includes another handler from cygwin (in Fig 5(b))!
It's the cygwin handler which directly terminates the process (without throwing any error messages); if it is the kernel32 handler, it would pop a standard windows error dialog.
 |
| Figure 5: SEH Chain of Int2dPrint_EAX_0_JZ0.exe before and after reaching the main() |
Case 2. Non-Debug Mode and IMM Debugger (column 3 in Table 1): Based on the logic of the two programs, you can soon reach the conclusion that the byte instruction right after int 2dh is skipped! There are two observations here: (1) the Cygwin handler is
NEVER executed! This is because the Immunity Debugger takes the control first (Recall the logic of KiDispatchException and the KiForwardException to debugger port). (2) Immunity Debugger modifies the value of EIP register, because the exception is a breakpoint. See discussion in Ferrie's article about IMM's behavior [
1]. The result of shifting one byte, however, is also affected by the kernel behavior (look at the EIP-- operation in KiDispatchException (see pp. 439 of Nebbett's book [2]). The combined effect is to shift one byte. Note that if replacing IMM with another user level debugger such as IDA, you might have a different result.
Case 3. Debug Mode without WinDbg Attached and CMD shell (column 4 in Table 1): windows freeze! The reason is clear: no debuggers are listening to the debug port and the breakpoint exception is not handled (no one advances the EIP register).
Case 4. Debug Mode without WinDbg Attached and Run in IMM (column 5 in Table 1): This is similar to case 2. If you F9 (and run the program) in IMM, you might notice that IMM stops at the
SECOND instruction right after int 2dh (i.e, "
CMP EAX,0") first (because it's a breakpoint exception, but the kernel debugging service is actually not triggered). If you F9 (continue) the program, it continues and exhibits the same behavior as Case 2. Again, the byte scission is the combined result of IMM and the kernel behavior (on int exceptions).
Case 5. Debug Mode with WinDbg Attached and Run in CMD shell (column 6 in Table 1):In this case, WinDbg stops at the
instruction right after int 2dh (i.e., "
inc EAX") and if continues, executes the "inc EAX" instruction.
Case 6. Debug Mode with WinDbg Attached and Run in IMM (column 7 in Table 1):In this case, WinDbg never gets the breakpoint exception, it's the user level debugger IMM gets the breakpoint exception first and like case 4, IMM readjusts the EIP register so that it stops at the
SECOND INSTRUCTION after int 2d. It is interesting to note that, even when WinDbg is initiated, if you start a user debugger, it gets/overrides the WinDbg on the processing of breakpoints. This is of course understandable -- think about using Visual Studio in the debugged mode for debugging a program, it is natural to pass the breakpoint event to Visual Studio first. Once the user level debugger declares that the exception has been handled, there is no need to to pass to the kernel debugger for handling.
Clearly,
IMM debugger has a "defect" in its implementation. First, it blindly processes a breakpoint exception even if this is not a registered exception in its breakpoint list. Second, the kernel service handles the readjustment of EIP differently for int 3 and int 2d (even though both of them are wrapped as the 80000003 exception in windows). When IMM does not differentiate the cases, the combined effect is that the readjustment of EIP is "over-cooked" and we see the byte scission.
3.3 Challenges of the Day
All of the above discussion are based on the assumption that EAX is 0 when calling the int 2d service. Notice that this is a value unexpected by the windows kernel -- the legal values are 1, 2, 3, and 4 (debug print, interactive, load image, unload image). Your challenges today is to find out the cases when EAX is set to 1, 2, 3, 4, and other unexpected values and assess the system behavior. You will have interesting discoveries.
4. Experiment 2: notepad
There is another interesting area we have not explored: the user installed SEH. The Int2d programs are good examples. The preamble code before the main function installs an SEH handler offered by Cygwin. It immediately leads to the termination of the process. It is interesting to observe the behavior of the default kernel32 handler. The following experiment sheds some light.
4.1 Experiment Design
When we use File->Open menu of notepad, we will always see a dialog popped up.
Our plan is to insert the code in Section 3.1 before the call for popping dialog, and observe if there is any byte scission.
The first question is how to locate the code in notepad.exe that launches a file open dialog. We will again use some immunity debugger tricks. It is widely known that user32.dll provides important system functions that are related to graphical user interface. We could examine the visible functions by user32.dll using the following approach.
- Open notepad.exe (in c:\windows) using the Immunity Debugger
- View -> Executable Modules
- Right click on "user32.dll" and select "View->Names". This exposes the entry address of all externally visible functions of the dll. Browse the list of functions, we may find a collections of functions such as CreateDialogIndirectParamA and CreateDialogIndirectParamW. Press "F2" to set a software breakpoint on each of them.
- Now F9 to run the notepad program. Click File->Open and the IMM stops at 7E4EF01F. Go back to the View->Names window, you will find that it is the entry address of CreateDialogIndirectParamW.
- Now remove all other breakpoints (except CreateDialogIndirectParam), so that we are not distracted by others. You can do this in View->Breakpoints window to remove the ones you don't want.
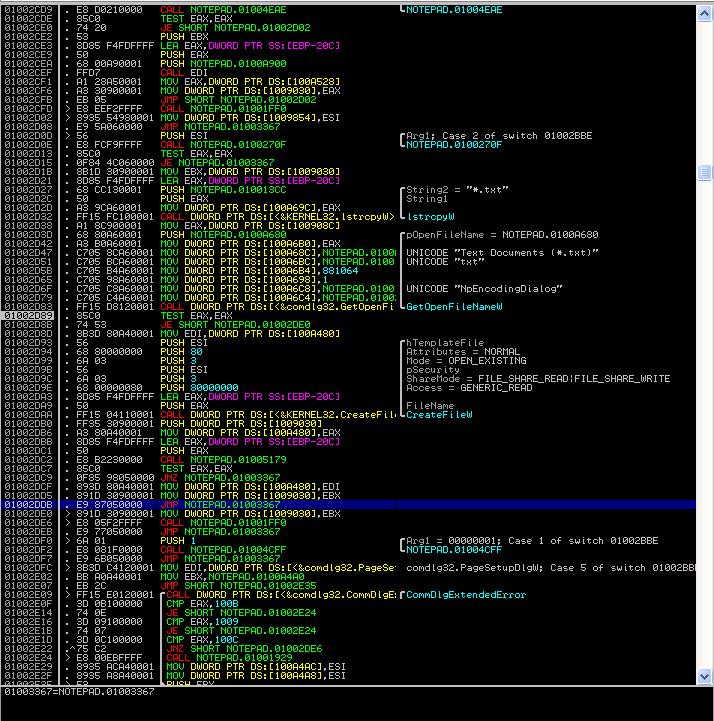
- Restart the program (make sure that your BP is set), click file->open, now you are stopping at CreateDialogIndirectParamW. We will now take advantage of once nice feature in IMM. Click Debug-> Execute Till User Code (to allow us get to the notepad.exe code directly!). Note that since the dialog is a modal dialog (which sticks there until you respond), you have to go back to the running notepad and cancel the dialog. Then the IMM stops at instruction 0x01002D89 of notepad.exe! This is right after the call of GetOpenFileNameW, which we just returns from.
 |
| Figure 6. Disassembly of notepad.exe |
The disassembly of notepad.exe is quite straightforward. At 0x01002D27, it sets up the dialog file filter "*.txt", and then at 0x01002D3D, it calls the GetOpenFileW function. The return value is stored in EAX. At 0x01002D89, it tests the value of EAX. If it is 0 (meaning the file dialog is canceled), the program control jumps to 0x01002DE0 (which directly exists the File->open processing).
We now can insert our instructions (most from Section 3.1) at 0x01002D27 (the side-effect is that the dialog file filter is broken - but this is ok). The code is shown below (we call it
notepad_EAX_0_JZ0.exe. Similarly, we can generate
notepad_EAX_0_JNZ0.exe):
------------------------------------
xor EAX, EAX # set EAX=0;
int 2d # invoke the exception handler
inc EAX # if executed, will set EAX=1
cmp EAX, 0
JZ 0x01002D89 # if EAX=0, will skip printf("BBBB");
-----------------------------------
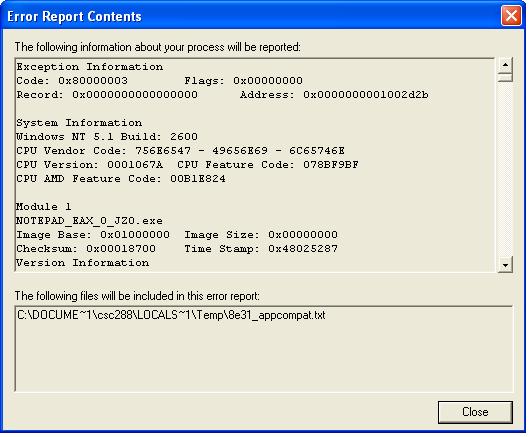
Run notepad_EAX_0_JZ0.exe in a command window (undebugged window), you will get the standard exception window thrown by windows. If you click the "details" link of the error dialog, you will be able to see the detailed information: note the error code 0x80000003 and the address of the exception (0x01002D2B!). I believe now you can easily draw the conclusion about the exception handler of kernel32.dll.
 |
| Figure 7: Error Report |
4.2 Challenge of the Day
Our question is:
are you sure that the error dialog is thrown by the handler of kernel32.7C839AC0? Prove your argument.
5. Experiment 3: SEH Handler Technique
Recall that the SEH handler installed by the user program itself can also affect the running behavior of int 2d. For example, Int2dPrint_EAX_0_JZ0.exe installed a handler in Cygwin1.dll, it leads to the termination of the process immediately; while the default kernel32.dll handler throws out an exception dialog that displays debugging information. In this experiment, we repeat Ferrie's example in [
3] and explore further potential possibilities of anti-debugging.
Figures 8 and 9 present our slightly adapted version of Ferrie's example in [
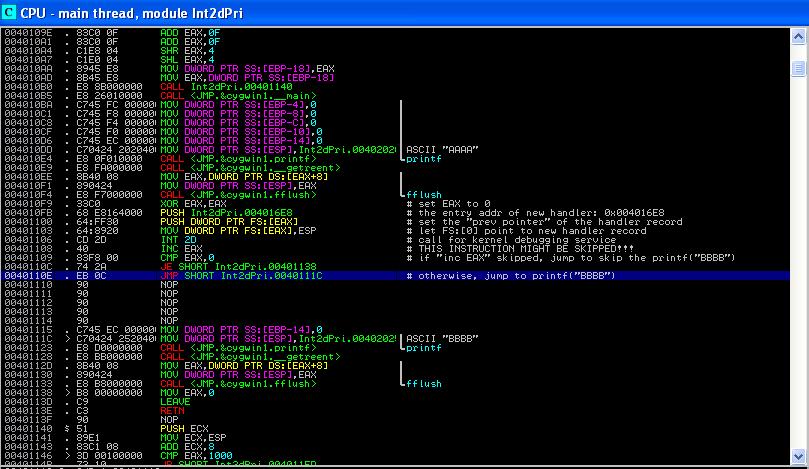
3] . The program is modified from the Int2dPrint.exe. The first part of the code is displayed in Figure 8, starting from 0x004010F9 and ending at 0x0040110E. We now briefly explain the logic.
Basically, the code is to install a new exception handler registration record (recall that SEH is a linked list and each registration record has two elements: prev pointer and the entry address of handler). So instruction at 0x004010FB is to set up the handler address attribute to
0x004016E8 (we'll explain later), and at 0x00401100 it is to set the prev pointer attribute. Then the instruction at 0x00401103 resets FS:[0], which always points to the first element in the SEH chain. The rest of the code does the old trick: it puts an "INC EAX" instruction right after the int 2d instruction and depending on whether the instruction is skipped, it is able to tell the existence of debugger.
 |
| Figure 8. Part I of Ferrie's Code |
We now examine the exception handler code at
0x004016E8. It is shown in Figure 9, starting at 0x004016E8 and ending at 0x004016F4. It has three instructions. At 0x004016E8, it puts a word 0x43434343 into address 0x00402025. If you study the instruction at 0x0040111c (in Figure 8), you might notice that at 0x00402025, it stores the string "BBBB". So this instruction is essentially to store "CCCC" into the RAM.
If the SEH handler is executed and if the second printf() statement is executed, you should see "AAAACCCC" in output, instead of "AAAABBBB". You might wonder, why not just change the value of a register (e.g., EBX) in the handler to indicate that the SEH is executed? Recall that interrupt handler of OS will recover the value of registers from kernel stack - no matter what value you set on a register (except for EAX), it will be wiped out by OS after return.
The last two instructions of the SEH handler simply returns 0. Notice that, as shown by Pietrek in [
1], "0" means
ExceptionContinueExecution, i.e., the exception has been handled and the interrupted process should resume. There are other values that you can play with, e.g., "1" means ExceptionContinueSearch, i.e., this handler could not solve the problem and the search has to be continued on the SEH chain to find the next handler. Note that these values are defined in the EXCEPT.h.
 |
| Figure 9. Part II of Ferrie's Code |
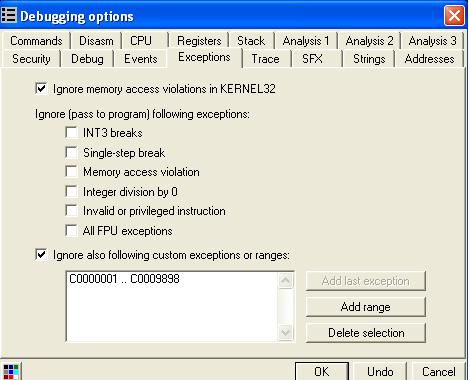
There could be another factor that affects your experimental results. The immunity debugger can be configured on whether or not to pass the exception to a user program. Click the "Debugger Options" menu in IMM, and then the "Exceptions" tab (shown in Figure 10). You can specify to pass all exceptions to user programs (by clicking the "add range" button and select all exceptions). After the configuration is done, running the program using "
Shift + F9" will pass the exceptions to user installed SEH (compared with F9).
 |
| Figure 10. Configuration of Exception Handling of IMM |
Similar to Section 4, we can run our program (Int2dprint_EAX0_RET0_JZ0.exe, meaning setting EAX to 0 when calling int 2d, and returning 0 in the SEH handler), under different environments, with debugging mode turned on or not. The results are displayed in Figure 11.
Non-debug mode: when running in command window, the output is "AAAACCCC". Clearly, the user installed SEH is executed and the byte scission did not occur (i.e., the "inc EAX" instruction is indeed executed). Compare it with the similar running environment in Table 1, you can immediately understand the effect of returning 0 in SEH: it tells the OS: "everything is fine. Don't kill the process!".
If you run the program in IMM, using F9 (without passing exceptions to user program), the result is "AAAA", where the "inc EAX" is skipped by IMM (similar to Table 1) and the user installed SEH is never executed; however, if you choose shift+F9 to pass exceptions to user program, the SEH is executed and the "inc EAX" is executed! It seems that in the "shift+F9" mode, IMM's does not re-adjust the EIP (as stated in Ferrie's article).
Debug-Mode with WinDbg Attached: Now when WinDbg is attached, the command line running of the program yields "AAAABBBB". This means that "inc EAX" is executed but the SEH is not executed! I believe, similarly, you can explain the IMM running result.
Now, the conclusion is:
the use of user installed SEH enables more possibilities to detect the existence of debuggers and how they are configured!
 |
| Figure 11. Experimental Results of Ferrie's Example |
5.1 Challenges of the Day
Play with the return values of your SEH handler, set it to 1, 2, and other values such as negative integers. What is your observation?
6. Conclusion
The int 2d anti-debugging technique is essentially an application of OS finger printing, i.e., from the behaviors of a system to tell its version and configuration. From the point of view of a program analysis researcher, it could be a very exciting problem to automatically generate such anti-debugging techniques, given the source/binary code of an operating system.
References
[1] M. Pietrek, "A Crash Course on the Depth of Win32Tm Structured Exception Handling," Microsoft System Journal, 1997/01. Available at
http://www.microsoft.com/msj/0197/exception/exception.aspxhttp://www.microsoft.com/msj/0197/exception/exception.aspx.
[2] G. Nebbett, "Windows NT/2000 Native API Reference", pp. 439-441, ISBN: 1578701996.
[3] P. Ferrie, "Anti-Unpacker Tricks - Part Three", Virus Bulletin Feb 2009. Available at
http://pferrie.tripod.com/papers/unpackers23.pdf, Retrieved 09/07/2011.


