Pages

Thursday, December 29, 2011

Malware Analysis Tutorial 9: Encoded Export Table

 Learning Goals:

  1. Practice reverse engineering techniques.
  2. Understand basic checksum functions.
Applicable to:
  1. Operating Systems.
  2. Computer Security.
  3. Assembly Language

1. Introduction
This tutorial answers the challenges in Tutorial 8. We explain the operations performed by Max++ which are related to export table. In this tutorial, we will practice analyzing functions that do not follow C language function parameter conventions, and examine checksum and encoding functions.

2. Lab Configuration
You can either continue from Tutorial 8, or follow the instructions below to set up the lab. Refer to Tutorial 1 and Tutorial 4 for setting up VBOX instances and WinDbg.
(1) In code pane, right click and go to expression "0x40105c"
(2) right click and then "breakpoints -> hardware, on execution"
(3) Press F9 to run to 0x40105c
(4) If you see a lot of DB instructions, select them and right click -> "During next analysis treat them as Command".
(5) Exit from IMM and restart it again and run to 0x40105c. Select the instructions (about 1 screen) below 0x40105c, right click -> Analysis-> Analyze Code. You should be able to see all loops now identified by IMM.

3. Analysis of Code from 0x40108C to0x4010C4
We now continue the analysis of Tutorial 8, which stops at 0x401087.

Figure 1. Code from 0x40108C to 0x4010C4
Recall that EAX at this moment points to the beginning of DLL base. From Figure 1 of Tutorial 8, we can infer that offset 120 (0x78), it is the EXPORT TABLE beginning address, and at offset 124 (0x7c), it is the EXPORT TABLE size. So the instruction COMP DWORD DS:[EAX+7C], 0 is to compare the size of export table with 0. Clearly, the JE instruction at 0x401091 will not be executed and the control flow will continue to 0x40109F.

Now let's observe the instruction MOV EDX, DWORD PTR DS:[ESI+18].  Note that ESI, after being set by instruction at 0x40108A, is now pointing at the export table. It contains value 0X7C903400 (which is the starting address of the export table). In Section 3 of Tutorial 8, we have given the data structure of the export table. From it, we can infer that offset 0x18 is the number of names. Thus, after the instruction is executed, EDX has the number of names (0x523) exported from ntdll.dll.

Using the same technique, we can infer that the subsequent instructions (0x4010AD to 0x4010C4) assigns registers EAX to EDI. We have:

  EAX <-- offset (relative to 0x7C90000 starting of ntdll base) of the beginning address of the array that stores function entry addrsses
  EBX <-- offset of the beginning of the array that stores the names of the functions
  EDI <-- offset of the array that stores the name ordinals (as we mentioned earlier, to find the entry address of a function, we have to find its index of the function name in the function name array, and then use the index to find the ordinal, and then use the ordinal to locate the entry address in the array of function entry address)

We can verify the above analysis. Take EBX as one example, its value is 0x7C9048B4. The following is the dump of the memory starting from that address. Note that each element is the "offset of the name". So the first element is 0x00006790 (it actually means that the string is located at 0x7C906790), and similarly, the second string is located at 0x7C9067A9. Figure 3 now displays the contents at 0x7C906790 (you can see that the first function name is CsrAllocateCaptureBuffer).


Figure 2: Array of Function Names


Figure 3: The Strings

4. Analysis of Function 0x004138A8
Now we proceed to the instruction at 0x004010C6 (see Figure 1). It calls the function located at 0x004138A8. Figure 4 shows a part of the function.

Figure 4: Function 0x004138A8
Notice that malware authors will not simply follow C language calling conventions (i.e., to push parameters into stack). Instead, they may use registers directly to pass information between function calls. To analyze the functionality/purpose of a function, we need to figure out: (1) what are the inputs and outputs? (2) and then the logic of the function.

To figure out the input parameters of the function, we look at those registers that are READ before assigned. Looking at the instructions beginning at 0x004138A8, we soon identify that EAX is the input parameter, at this moment its value is 0x00002924. Recall that in Section 3, it contains the offset of the beginning of the array that contains function entry addresses, i.e., 0x7C902924 is the beginning of the array that contains function entry addresses.

Then starting from 0x004138A9, the next few arithmetic instructions seem to be rounding the value of ECX based on EAX. Now Figure 5 shows the second half of the function. There are two interesting instructions, first the instruction at 0x0041389A (it is to reduce the value of EAX by 0x1000 inside a loop), and then the instruction of 0x413893, it is to exchange the value of EAX and ESP.

So the eventual output is the ESP register, which has multiples of 0x1000 bytes (in our case 0x2000 bytes) reduced compared with its original value.

In a word, the function at 0x004138A8 expands the stack frame (recall the stack grows from higher address to lower address) by 0x2000 bytes. Why? It is used to hold the new export table, which is encoded!

Challenge 1 of the Day: where does the new export table start?


Figure 5: Second Half of Function 0x004138A8
5. Rest of Encoding Function
We now proceed to analyze the code between 0x4010CB to 0x40113B. Note that the expanded stack now includes around 0x2000 bytes from 0x0012D66C. This is going to hold encoded export table. This encoded table (its format) is defined by the malware author himself/herself. Each entry has two elements and each element 4 bytes. The first element is the checksum of the function name, and the second is the function address. Later, the Max++ malware is able to invoke the system functions in ntdll.dll without resolving them using the export table of ntdll.dll, but using its own encoded table.


Figure 6. Code from 0x4010CB to 0x40113B
Most of the program logic is pretty clear. Instructions from 0x4010D0 to 0x40DF save some important information to stack. Now [EBP-C] and [EBP-14] both have value 0x0012D66C (which is ESP+C). This is going to be the beginning of the encoded table, which will be demonstrated by the code later.

Then there is a 2-layer nested loop from 0x004010F9 to 0x00401136. Let's first look at the inner loop from 0x401103 to 0x401110. Clearly, EAX is the input for this inner loop and note that EAX is pointing to the array of chars that represent the function name (at 0x004010FB). At 0x401110, EAX is incremented by one in each iteration of the inner loop. Clearly, the inner loop is doing some checksum computation of the function name. In the checksum loop, there are two registers being written by the code: EDX and ECX. If you read the code carefully, you will note that the value of EDX is overwritten completely in each iteration (note instruction at 0x401103). Only ECX's previous value affects its next value. Thus ECX must be the output and it saves the checksum!

Then the instructions from 0x401117 to 0x401133 are to set up the entry for the function. The instruction at 0x40111D (MOV DS:[EAX], ECX) is to save the checksum of the function to the first element, and then the instruction at 0x0040112B saves the function address as the second element.

Challenge 2 of the Day: Explain the logic of EDX+ECX*4 of the instruction at 0x00401122. Hint: study the use of ordinal numbers in export table.


5. Conclusion
Our conclusion is: Max++ reads the export table of ntdll.dll and builds an encoded export table for itself. We will later see its use.

6. Challenge of the Day
At 0x0040113E,  Max++ calls 0x0040165E. Analyze the functionality of 0x0040165E.

Sunday, December 25, 2011

Malware Analysis Tutorial 8: PE Header and Export Table

Learning Goals:

  1. Understand the portable executable (PE) header of binary executables.
  2. Understand the EXPORT TABLE.
  3. Practice disassemble and reverse engineering techniques.
Applicable to:
  1. Operating Systems.
  2. Computer Security.

1. Introduction

In this tutorial, we will analyze the first harmful operation performed by Max++. It changes the structure of the export table of ntdll.dll. Recall the analysis of Max++ in Tutorial 7, the malware reads the information in TIB and PEB, and examines the loaded modules one by one, until it encounters "ntdll.dll" (this is accomplished using a checksum function inside a two layer nested loop).

In this tutorial, we will reverse engineer the code starting at 0x40105C.

2. Background Information of PE Header
Any binary executable file (no matter on Unix or Windows) has to include a header to describe its structure: e.g., the base address of its code section, data section, and the list of functions that can be exported from the executable, etc. When the file is executed by the operating system, the OS simply reads this header information first, and then loads the binary data from the file to populate the contents of the code/data segments of the address space for the corresponding process. When the file is dynamically linked (i.e., the system calls it relies on are not statically linked in the executable), the OS has to rely on its import table to determine where to find the entry addresses of these system functions.

Most binary executable files on Windows follows the following structure: DOS Header (64 bytes), PE Header, sections (code and data). For a complete survey and introduction of the executable file format, we recommend Goppit's "Portable Executable File Format - A Reverse Engineering View" [1].

DOS Header starts with magic number 4D 5A 50 00, and the last 4 bytes is the location of PE header in the binary executable file. Other fields are not that interesting. The PE header contains significantly more information and more interesting. In Figure 1, please find the structure of PE Header. We only list the information that are interesting to us in this tutorial. For a complete walk-through, please refer to Goppit's work [1].
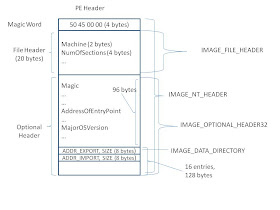
Figure 1. Structure of PE Header
 At run time of a binary executable, Windows loader actually loads the PE header into a process's address space. There are some well defined data structures defined in winnt.h for each of the major part of the PE header.

As shown in Figure 1, PE header consists of three parts: (1) a 4-byte magic code, (2) a 20-byte file header and its data type is IMAGE_FILE_HEADER, and (3) a 224-byte optional header (type: IMAGE_OPTIONAL_HEADER32). The optional header itself has two parts: the first 96 bytes contain information such as major operating systems, entry point, etc. The second part is a data directory of 128 bytes. It consists of 16 entries, and each entry has 8 bytes (address, size).

We are interested in the first two entries: one has the pointer to the beginning of the export table, and the other points to the import table.


2.1 Debugging Tool Support (Small Lab Experiments)
Modern binary debuggers have provided sufficient support for examining PE headers. We discuss the use of WinDbg and Immunity Debugger.

(1) WinDbg. Assume that we know that the PE structure of ntdll.dll is located at memory address 0x7C9000E0. We can display the second part: file header using the following.

dt nt!_IMAGE_FILE_HEADER 0x7c9000e4
   +0x000 Machine          : 0x14c
   +0x002 NumberOfSections : 4
   +0x004 TimeDateStamp    : 0x4802a12c
   +0x008 PointerToSymbolTable : 0
   +0x00c NumberOfSymbols  : 0
   +0x010 SizeOfOptionalHeader : 0xe0
   +0x012 Characteristics  : 0x210e


Then we can calculate the starting address of the optional header: 0x7C9000E4 + 0x14 (20 bytes) = 0x7C9000F8. The attributes of optional header is displayed as below. For example, the major linker version is 7 and the the address of entry point is 0x12c28 (relative of the base address 0x7c900000).


kd> dt _IMAGE_OPTIONAL_HEADER 0x7c9000F8
nt!_IMAGE_OPTIONAL_HEADER
   +0x000 Magic            : 0x10b
   +0x002 MajorLinkerVersion : 0x7 ''
   +0x003 MinorLinkerVersion : 0xa ''
   +0x004 SizeOfCode       : 0x7a000
   +0x008 SizeOfInitializedData : 0x33a00
   +0x00c SizeOfUninitializedData : 0
   +0x010 AddressOfEntryPoint : 0x12c28
   +0x014 BaseOfCode       : 0x1000
   +0x018 BaseOfData       : 0x76000
   +0x01c ImageBase        : 0x7c900000
   +0x020 SectionAlignment : 0x1000
   +0x024 FileAlignment    : 0x200
   +0x028 MajorOperatingSystemVersion : 5
   +0x02a MinorOperatingSystemVersion : 1
   +0x02c MajorImageVersion : 5
   +0x02e MinorImageVersion : 1
   +0x030 MajorSubsystemVersion : 4
   +0x032 MinorSubsystemVersion : 0xa
   +0x034 Win32VersionValue : 0
   +0x038 SizeOfImage      : 0xaf000
   +0x03c SizeOfHeaders    : 0x400
   +0x040 CheckSum         : 0xb62bc
   +0x044 Subsystem        : 3
   +0x046 DllCharacteristics : 0
   +0x048 SizeOfStackReserve : 0x40000
   +0x04c SizeOfStackCommit : 0x1000
   +0x050 SizeOfHeapReserve : 0x100000
   +0x054 SizeOfHeapCommit : 0x1000
   +0x058 LoaderFlags      : 0
   +0x05c NumberOfRvaAndSizes : 0x10
   +0x060 DataDirectory    : [16] _IMAGE_DATA_DIRECTORY

As shown by Goppit [1], OllyDbg can display PE structure nicely. Since the Immunity Debugger is based on OllyDbg, we can achieve the same effect. In IMM View -> Memory, we can easily locate the starting address of each module (e.g., see Figure 2).
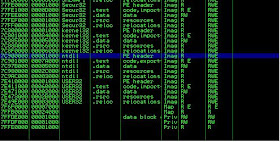

Figure 2. Getting PE Header Address
Then in the memory dump window, jump to the starting address of the PE of ntdll.dll. Then right click in the dump pane, and select special -> PE, we can have all information nicely presented by IMM.


3. Export Table

Recall that the first entry of IMAGE_DATA_DIRECTORY of the optional header field contains information about the export table. By Figure 1, you can soon infer that the 4 bytes located at PE + 0x78 (i.e., offset 120 bytes) is the relative address (relative to DLL base address) of the export table, and the next byte (at offset 0x7C) is the size of the export table.

The data type for the export table is  IMAGE_EXPORT_DIRECTORY. Unfortunately, the WinDbg symbol set does not include the definition of this data structure, but you can easily find it in winnt.h through a google search (e.g., from [2]). The following is the definition of IMAGE_EXPORT_DIRECTORY from [2].

typedef struct _IMAGE_EXPORT_DIRECTORY {
  DWORD Characteristics; //offset 0x0
  DWORD TimeDateStamp; //offset 0x4
  WORD MajorVersion;  //offset 0x8
  WORD MinorVersion; //offset 0xa
  DWORD Name; //offset 0xc
  DWORD Base; //offset 0x10
  DWORD NumberOfFunctions;  //offset 0x14
  DWORD NumberOfNames;  //offset 0x18
  DWORD AddressOfFunctions; //offset 0x1c
  DWORD AddressOfNames; //offset 0x20
  DWORD AddressOfNameOrdinals; //offset 0x24
 }

Here, we need some manual calculation of addresses for each attribute for our later analysis. In the above definition, WORD is a computer word of 16 bites (2bytes), and DWORD is 4 bytes. We can easily infer that, MajorVersion is located at offset 0x8, and AddressOfFunctions is located at offset 0x1c.

Now assume that IMAGE_EXPORT_DIRECTORY is located at 0x7C903400, the following is the dump from WinDbg (here "dd" is to display memory):

kd> dd 7c903400
7c903400  00000000 48025c72 00000000 00006786
7c903410  00000001 00000523 00000523 00003428
7c903420  000048b4 00005d40 00057efb 00057e63
7c903430  00057dc5 00002ad0 00002b30 00002b40
7c903440  00002b20 0001eb58 0001ebb9 0001e3af
7c903450  0002062d 000206ee 0004fe3a 00012d71
7c903460  000211e7 0001eaff 0004fe2f 0004fdaa
7c903470  0001b08a 0004febb 0004fe6d 0004fde6

We can soon infer that there are 0x523 functions exposed in the export table, and there are 0x523 names exposed. Why? Because the NumberOfFunctions is located at offset 0x14 (thus its address is 0x7c903400+0x14 = 0x7c903414)  For another example, look at the attribute "Name" which is located at offset 0xc (i.e., its address: 0x7c90340c), we have number 0x00006787. This is the address relative to the base DLL address (assume it is 0x7c900000). Then we have the name of the module located at 0x7c906786. We can verify using the "db" command in WinDbg (display memory contents as bytes): you can verify that the module name is indeed ntdll.dll.


kd> db 7c906786
7c906786  6e 74 64 6c 6c 2e 64 6c-6c 00 43 73 72 41 6c 6c  ntdll.dll.CsrAll
7c906796  6f 63 61 74 65 43 61 70-74 75 72 65 42 75 66 66  ocateCaptureBuff


Read page 26 of [1], you will find that the "AddressOfFunctions", "AddressOfNames", and "AddressOfNameOdinals" are the most important attributes. There are three arrays (shown as below), and each of the above attributes contains one corresponding starting address of an array.

PVOID Functions[523]; //each element is a function pointer
char * Names[523]; //each element is a char * pointer
short int Ordinal[523]; //each element is an 16 bit integer

For example, by manual calculation we know that the Names array starts at 7C9048B4 (given the 0x48B4 located at offset 0x20, for attribute AddressOfNames; and assuming the base address is 0x7C900000). We know that each element of the Names array  is 4 bytes. here is the dump of the first 8 elements:
kd> dd 7c9048b4
7c9048b4  00006790 000067a9 000067c3 000067db
7c9048c4  00006807 0000681f 00006831 00006845


We can verify the first name (00006790): It's CsrAllocateCaptureBuffer. Note that a "0" byte is used to terminate a string.
kd> db 7c906790
7c906790  43 73 72 41 6c 6c 6f 63-61 74 65 43 61 70 74 75  CsrAllocateCaptu
7c9067a0  72 65 42 75 66 66 65 72-00 43 73 72 41 6c 6c 6f  reBuffer.CsrAllo


We can also verify the second name (000067a9): It's CsrAllocateMessagePointer.
kd> db 7c9067a9
7c9067a9  43 73 72 41 6c 6c 6f 63-61 74 65 4d 65 73 73 61  CsrAllocateMessa
7c9067b9  67 65 50 6f 69 6e 74 65-72 00 43 73 72 43 61 70  gePointer.CsrCap


Now, given a Function name, how do we find its entry address? The following is the formula:
Note that array index starts from 0.
Assume Names[x].equals(FunctionName)
Function address is Functions[Ordinal[x]]

4. Challenge1 of the Day
The first sixteen elements of the Ordinal is shown below:
kd> dd 7c905d40
7c905d40  00080007 000a0009 000c000b 000e000d
7c905d50  0010000f 00120011 00140013 00160015


The first eight elements of the Functions array is shown below:
kd> dd 7c903428
7c903428  00057efb 00057e63 00057dc5 00002ad0
7c903438  00002b30 00002b40 00002b20 0001eb58


What is the entry address of function CsrAllocateCaptureBuffer? The answer is: it's 7C91EB58. Think about why? (Pay special attention to the byte order of integers).


5. Analysis of Code
We now start to analyze the code, starting at 0x40105C. Set a hardware breakpoint at 0x40105C (in code pane, right click -> Go To Expression (0x40105c) and then right click -> breakpoints -> hardware, on execution). Press F9 to run to the point. The first instruction should be PUSH DS:[EAX+8]. If you see a bunch of BYTE DATA instructions, that's caused by the byte scission of the code. Highlight all these BYTE DATA instructions, right click -> Treat as Command during next analysis and we should have the correct disassembly displayed in IMM.

Figure 4: Accessing Export Table


Now let us analyze the first couple of instructions starting at 0x40105C (in Figure 4). Continuing the analysis of Tutorial 7, we know that  after reading the module information (one by one), the code jumps out of the loop when it encounters the ntdll.dll. At this moment, EAX contains the address of offset 0x18 of LDR_DATA_TABLE_ENTRY. In another word, EAX points to the attribute "DllBase". Thus, the instruction at 0x40105C, i.e., PUSH DWORD DS:[EAX+8] is to push the DllBase into the stack. Executing this command, you will find that 0x7C900000 appearing on top of the stack.

The control flow soon jumps to 0x401077 and 0x401078. It soon follows that at 0x401070, ECX now has value 0x7C90000 (the DLL base).  Now consider the instruction 0x40107D:
       MOV EAX, DWORD PTR DS:[ECX+3C]

Recall that the beginning of a PE file is the DOS header (which is 64 bytes) and the last 4 bytes of the DOS header contains the location of the PE header (offset relative to the DLL base) [see Section 2]. Hex value 0x3C is decimal value 60! So we now have EAX containing of PE offset. Observing the registry pane, we have EAX = 0xE0. We then infer that PE header is located at 0x7C9000E0 (which is 0x7C900000 base + offset 0xE0).

Now observe instruction at 0x401087:
    MOV ESI, DWORD PTR DS:[EAX+78]

Note the offset 0x78, its decimal value is 120. From Figure 1, we can soon infer that offset 0x78 is the address of the EXPORT table data entry in the IMAGE_DATA_DIRECTORY of the optional header. Thus, ESI now contains the entry address of the export table (offset relative to DLL base) ! After instruction at 0x40108c, Its value is now 0x7C903400 (starting address of EXPORT TABLE).


5. Challenge of the Day
We have demonstrated to you some basic analysis techniques to reverse engineer the malicious logic. Now your job is to continue our analysis and explain what the Max++ malware is trying to do. Specifically, you can follow the road-map below:
(1) What does function 0x004138A8 do? What are its input parameters?
(2) Which data fields of the export table are the instructions between 0x4010AD and 0x4010C4 accessing?
(3) Explain the meaning of EDX*+C in the instruction at 0x4010BB.
(4) Explain the logic of 0x4010CB to 0x4010F6.
(5) What is the purpose of the loop from 0x401103 to 0x401115?
(6) What does function 0x40165E do? What are its input parameters?
(7) Explain the code between 0x401117 and 0x40113E.


References
1. Goppit, "Portable Executable Format - a Reverse Enginnering View", v1(2), Code Breakers Magzine, January 2006.
2. An online copy of winnt.h, Available at http://source.winehq.org/source/include/winnt.h

Wednesday, December 14, 2011

Malware Analysis Tutorial 7: Exploring Kernel Data Structure

Learning Goals:

  1. Explore kernel data structures effectively, e.g., using WinDbg.
  2. Understand the important kernel structures of Windows to maintain live information about processes and threads.
  3. Know the difference between hard and soft breakpoints and can use them effectively during debugging.
  4. Practice code reverse engineering to understand assembly code.
Applicable to:
  1. Computer Architecture
  2. Operating Systems Security
  3. Assembly Language
  4. Operating Systems
1. Introduction

     This tutorial shows you how to explore kernel data structures of windows using WinDbg. It is very beneficial to us for understanding the infection techniques employed by Max++. We will look at some interesting data structures such as TIB (Thread Information Block), PEB (Process Information Block), and the loaded modules/dlls of a process. We will examine what Max++ did to some important kernel DLL files.

1.1 Lab Setup
If you have not installed WinDbg on your host machine (note: not the VM instance), please follow Tutorial 1 first to install the VirtualBox platform (a small LAN consisting of one Linux gateway and one Windows instance infected with Max++). Then please follow Tutorial 4 to install WinDbg on the host machine (note: not the VM instances) and configure the piped COM port for the VM instance to be debugged.  The following is the steps of launching the VM instance and WinDbg:

  1. Launch the Windows guest OS in VirtualBox first. Boot it in the "Debugged" mode. (Follow Tutorial 4 for how to include the "Debugged" boot option).
  2. On your Host machine, start a command window and change directory to "c:\Program Files\Debugging Tools for Windows(x86)" and type the following.
    windbg -b -k com:pipe,port=\\.\pipe\com_11
  3.  You should see in the WinDbg window the following "Breakpoint on INT 3". It means that it currently stops at a software breakpoint (INT 3). Type "g" (means "go") to let it continue. If necessary, "g" it a second time.
  4. Occasionally you might find that your windows guest OS is frozen. Simply in the WinDbg window (at the host) type "g".
  5. Now start the Immunity Debugger in the windows guest OS, and load the Max++ (see Tutorial 1 for where to get Max++ binary).
  6. In the Code Pane of IMM, right click to go to "0x401018" and then set a HARD BREAKPOINT (right click and select "Breakpoint->Hardware, on Execution") at it. This is where we stopped at in Tutorial 6. As you see right now, the instruction at 0x401018 is "DEC DWORD [EAX+20]". Later, when we stop at this address, the instruction will be overwritten, due to the self-extracting feature of Max++, see details in Tutorial 6.  Then Press F9 (continue) to run to 0x00401018.

 1.1.1 Why Hardware Breakpoint?
  Notice that, you have to use hardware breakpoint in Step 6. Why not software breakpoint? Think about how software breakpoint is implemented. When you set a software breakpoint in a debugger, the debugger actually modifies the first byte of the instruction at that location to "INT 3". When the execution gets to the "INT 3", the windows kernel calls debugger to handle the interrupt (which then stops and highlights it in the debugger window, and when you resume the execution or cancel the breakpoint, the debugger writes the original opcode back).

 Recall that the malware does self-extraction (see Tutorial 6). It overwrites the "INT 3" and you will never be able to stop at the desired location 0x401018! That's the reason we use hardware breakpoint. When a hardware breakpoint is set, the address is recorded in one of the four HW breakpoint registers provided by an Intel CPU. The CPU examines the registers everytime one instruction is executed and stops at it. The only drawback is that you can set up to 4 hardware breakpoints at any time.

1.2 Analysis Objective
We will analyze around 20 instructions, from 0x00401018 to 0x0040105B. The assembly code is shown in Figure 1.


Figure 1. Code Segment to Analyze (0x401018 to 0x40105B)


2. FS Register, TIB, and PEB


As shown in Figure 1, instruction 0x00401018 (MOV EAX, DWORD FS:[18]) does some important trick . It is reading the memory word located at FS:[18] into EAX. Here FS, like SS and DS, is one of the segment registers provided in Intel x86 register file.  The FS:[18]is an address specified using the displacement addressing mode. The address is calculated as [value stored in FS] + 0x18. 

Whenever you see some code accessing the FS register, you should pay special attention! FS points to the most important Windows kernel data structure related to the current process/thread. Check out reference [1] for details and you will see that FS:[18] stores the entry address of TIB (Thread Information Block) - also called TEB.

Then the instruction at 0x40101E (MOV EAX, [EAX+30]) takes the word located at EAX+0X30. What does this mean? Since now EAX has the entry address of the TIB, it is now taking some data field which is 0x30 bytes away from the beginning of the TIB record.

We need to figure out the internal data structure of TIB. There are two ways: (1) MSDN document, and (2) take advantage of the WinDbg kernel debugger. For the most well known data structures like TIB, people have already done the address calculation for you. For example, by reading [1], you would know that offset 0x30 stores the entry address of PEB (process information block). But for most cases, for a kernel data structure, you'll have to manually calculate the offset (i.e., figure out the size of all the previous attributes in the structure and sum them up).

The most convenient way would be using WinDbg. Now come back to our WinDbg window in the host machine and type the following: (Ctrl+Break). This is to interrupt the running of the guest windows and get the control back to WinDbg. Then type the following:

dt nt!_TEB

This is to say, display the data type of "_TEB" located in the nt module. If you need information of the "nt" module, you can type

lm

This displays the loaded modules and you can see that  "nt" is the module name for "ntoskrnl.dll".

WinDbg is actually very powerful, by appending "-r n" to the dt command, you can display the data types recursively, i.e., when a data field itself is a complex data type, you can display its contents. For example, dt nt!_TEB -r 2 display the contents recursively and the extraction level is 2.

From the WinDbg dt dump, you can immediately infer that 0x30 of TEB is the entry address of PEB.

3. Loaded Module List
We now proceed to the next few instructions.  Using the technique introduced in Section 2, we can infer that instruction at 0x401021 (MOV ECX, [EAX+C]) loads into the ECX the pointer to LDR (loaded module list). The information of PEB structure can be found on MSDN [2], however, you will find that WinDbg actually can provide more detailed information, including many undocumented attributes.

Now we need to look at the structure of LDR (_LIST_ENTRY). Executing dt nt!_PEB_LDR_DATA in WinDbg, we have the following dump:

kd> dt _PEB_LDR_DATA
nt!_PEB_LDR_DATA
   +0x000 Length           : Uint4B
   +0x004 Initialized      : UChar
   +0x008 SsHandle         : Ptr32 Void
   +0x00c InLoadOrderModuleList : _LIST_ENTRY
   +0x014 InMemoryOrderModuleList : _LIST_ENTRY
   +0x01c InInitializationOrderModuleList : _LIST_ENTRY
   +0x024 EntryInProgress  : Ptr32 Void
kd> dt _LIST_ENTRY
nt!_LIST_ENTRY
   +0x000 Flink            : Ptr32 _LIST_ENTRY
   +0x004 Blink            : Ptr32 _LIST_ENTRY


 Notice that ECX now contains the address of the offset 0xC of the _PEB_LDR_DATA, starting at this address is a _LIST_ENTRY structure which contains two computer words (each word is 4 bytes long). The first four bytes is the Flink, which points to the next _LIST_ENTRY, and the next four bytes is the Blink, which points to the previous _LIST_ENTRY. So this is exactly a doubly linked list structure! More details of the PEB_LDR_DATA structure can be found in MSDN document [4]. However, again, notice that the documentation in [4] is not complete and is NOT accurate! The most authorative information should be from WinDbg.


Now let us proceed to instruction 00401029 (MOV EAX, DWORD [ECX]). This is essentially to move the contents of the FLink to EAX. Now according to [4], the EAX now has the entry address of the_LDR_DATA_TABLE_ENTRY for the next module. However, it is WRONG! the correct information is that EAX now contains the address of the offset 0x8 of _LDR_DATA_TABLE_ENTRY (i.e., the address of the data field "InMemoryOrderLinks")

Now comes the interesting part. Look at instruction 0x0040102D (MOV EDX, DWORD [EAX+20]), what does this mean? Let's examine the data structure LDR_DATA_TABLE_ENTRY first.

kd> dt _LDR_DATA_TABLE_ENTRY -r2
nt!_LDR_DATA_TABLE_ENTRY
   +0x000 InLoadOrderLinks : _LIST_ENTRY
      +0x000 Flink            : Ptr32 _LIST_ENTRY
         +0x000 Flink            : Ptr32 _LIST_ENTRY
         +0x004 Blink            : Ptr32 _LIST_ENTRY
      +0x004 Blink            : Ptr32 _LIST_ENTRY
         +0x000 Flink            : Ptr32 _LIST_ENTRY
         +0x004 Blink            : Ptr32 _LIST_ENTRY
   +0x008 InMemoryOrderLinks : _LIST_ENTRY
      +0x000 Flink            : Ptr32 _LIST_ENTRY
         +0x000 Flink            : Ptr32 _LIST_ENTRY
         +0x004 Blink            : Ptr32 _LIST_ENTRY
      +0x004 Blink            : Ptr32 _LIST_ENTRY
         +0x000 Flink            : Ptr32 _LIST_ENTRY
         +0x004 Blink            : Ptr32 _LIST_ENTRY
   +0x010 InInitializationOrderLinks : _LIST_ENTRY
      +0x000 Flink            : Ptr32 _LIST_ENTRY
         +0x000 Flink            : Ptr32 _LIST_ENTRY
         +0x004 Blink            : Ptr32 _LIST_ENTRY
      +0x004 Blink            : Ptr32 _LIST_ENTRY
         +0x000 Flink            : Ptr32 _LIST_ENTRY
         +0x004 Blink            : Ptr32 _LIST_ENTRY
   +0x018 DllBase          : Ptr32 Void
   +0x01c EntryPoint       : Ptr32 Void
   +0x020 SizeOfImage      : Uint4B
   +0x024 FullDllName      : _UNICODE_STRING
      +0x000 Length           : Uint2B
      +0x002 MaximumLength    : Uint2B
      +0x004 Buffer           : Ptr32 Uint2B
   +0x02c BaseDllName      : _UNICODE_STRING
      +0x000 Length           : Uint2B
      +0x002 MaximumLength    : Uint2B
      +0x004 Buffer           : Ptr32 Uint2B
   +0x034 Flags            : Uint4B
   +0x038 LoadCount        : Uint2B
   +0x03a TlsIndex         : Uint2B
   +0x03c HashLinks        : _LIST_ENTRY
      +0x000 Flink            : Ptr32 _LIST_ENTRY
         +0x000 Flink            : Ptr32 _LIST_ENTRY
         +0x004 Blink            : Ptr32 _LIST_ENTRY
      +0x004 Blink            : Ptr32 _LIST_ENTRY
         +0x000 Flink            : Ptr32 _LIST_ENTRY
         +0x004 Blink            : Ptr32 _LIST_ENTRY
   +0x03c SectionPointer   : Ptr32 Void
   +0x040 CheckSum         : Uint4B
   +0x044 TimeDateStamp    : Uint4B
   +0x044 LoadedImports    : Ptr32 Void
   +0x048 EntryPointActivationContext : Ptr32 Void
   +0x04c PatchInformation : Ptr32 Void

We know that the instruction MOV EDX, DWORD [EAX+20] is to load the contents of the word located at EAX+0x20. But where is EAX pointing at? It's pointing at offset 0x8 of the _LDR_DATA_TABLE_ENTRY. Thus EAX+0x20 is pointing at offset 0x28 (see the emphasized area of the data structure dump above), which is the "Buffer" field of the FullDllName.

In Windows, _UNICODE_STRING is Microsoft's effort to cope with the multi-cultural/language needs for localization of windows in different parts of the world. It consists of two parts: (1) length of the string, and (2) the real raw data of the string. So the "Buffer" field encodes the full DLL name in unicode!

What it essentially means is that code at 0x0040102Dis starting to process/read the DLL name! To verify our conjecture, look at the register EDX in the Immunity Debugger (Figure 3).You can see that the first module name we are looking at is "ntdll.dll".


Figure 3: EDX points to DLL Name

4. Challenges of the Day
Now let us try to get the whole picture of the code from 0x00401018 to 0x00401054. You might notice that we have actually a nested 2-layer loop here.

The outer loop is from 0x40102E to 0x401054, this is essentially a do-while loop. The inner loop is from 0x401036 to 0x401046. Our challenges today are:
(1) What does the inner loop from 0x401036 to 0x401046 do?
(2) What does the out-loop do?

A hint here: the code we discussed today tries to search for a module and do some bad things to that module (these malicious operations will start at 0x40105C). Use your immunity debugger to find it out. We will show you these malicious operations in the next tutorial.

References
1. Wiki, "Windows Thread Information Block", Available at http://en.wikipedia.org/wiki/Win32_Thread_Information_Block
2. Microsoft, "PEB Structure", Available at http://msdn.microsoft.com/en-us/library/windows/desktop/aa813706(v=vs.85).aspx
3.Microsoft, "PEB_LDR_DATA structure", Available at http://msdn.microsoft.com/en-us/library/windows/desktop/aa813708(v=vs.85).aspx


Tuesday, December 6, 2011

Malware Analysis Tutorial 6: Analyzing Self-Extraction and Decoding Functions

Learning Goals:

  1. Use Immunity Debugger to Analyze and Annotate Binary Code.
  2. Understand the Techniques for Self-Extraction in Code Segment.
Applicable to:
  1. Computer Architecture
  2. Operating Systems Security
1. Introduction


In this tutorial, we discuss several interesting techniques to analyze decoding/self-extraction functions, which are frequently used by malware to avoid static analysis. The basic approach we use here is to execute the malware step by step, and annotating the code.

1.1 Goals
We will examine the following functions in Max++ (simply set a breakpoint at each of the following addresses):
  • 0x00413BC2
  • 0x00413BDD
  • 0x00413A2B
  • 0x00410000
  • 0x00413BF2

1.2 General Techniques
 We recommend that you try your best to analyze the aforementioned functions first, before proceeding to section 2. In the following please find several useful IMM tricks:
  • Annotating code: this is the most frequently used approach during a reverse engineering effort. Simply right click in the IMM code pane and select "Edit Comment", or press the ";" key.
  • Labeling code: you could set a label at an address (applicable to both code and data segments). When this address is used in JUMP and memory loading instructions, its label will show up in the disassembly. You can use this to assign mnemonics to functions and variables. To label an address, right click in IMM code pane and select "Label".
  • Breakpoints: to set up software breakpoints press F2. To set up hardware breakpoints, right click in code pane, and select Breakpoints->Hardware Breakpoint on Execution. At this moment, set soft breakpoints only.
  • Jump in Code Pane: you can easily to any address in the code segment by right clicking in code pane and enter the destination address.


2. Analysis of Code Beginning at 0x00413BC2

As shown in Figure 1, there are four related instructions, POP ESI (located at 0x00413BC1), SUB ESI, 9 (located at 0x00413BC2), and the POP ESP and RETN instructions.

Figure 1. Code Starting at 0x00413BC2

 As discussed in Tutorial 5, the RETN instruction (at 0x00413BC0) is skipped by the system when returning from INT 2D (at 0x00413BBE). Although it looks like the POP ESI (at 0x413BC1) is skipped, it is actually executed by the system. This results in that ESI now contains value 0x00413BB9 (which is pushed by the instruction CALL 0x00413BB9 at 0x00413BB4). Then the SUB ESI, 9 instruction at 0x00413BC2 updates the value of ESI to 0x00413BB0. Then the next LODS instruction load the memory word located at 0x00413BB0 into EAX (you can verify that the value of EAX is now 0). Then it pops the top element in the stack into EBP, and returns. The purpose of the POP is to simply enforce the execution to return (2 layers) back to 0x413BDD.

Note that if the INT 2D has not caused any byte scission, i.e., the RETN instruction at 0x00413BD7 will lead the execution to 0x413A40 (the IRETD instruction). IRETD is the interrupt return instruction and cannot be run in ring3 mode (thus causing trouble in user level debuggers such as IMM). From this you can see the purpose of the POP EBP instruction at 0x413BC6.

Conclusion: the 4 instructions at 0x00413BC2 is responsible for directing the execution back to 0x00413BDD. This completes the int 2d anti-debugging trick.

3. Analysis of Function 0x00413BDD


Figure 2: Function 0x00413BDD


As shown in Figure 2, this function clears registers and calls three functions: 0x413A2B (decoding function), 0x00401000 (another INT 2D trick), and call EBP (where EBP is set up by the function 0x00401000 properly). We will go through the analysis of these functions one by one.


4. Analysis of Function 0x00413A2B.

Figure 3: Function 0x00413A2B


 Function 0x00413A2B has six instructions and the first five forms a loop (from 0x00413A2B to 0x00413A33), as shown in Figure 3.  Consult the Intel instruction manual first, and read about the LODS and STORS instruction before proceeding to the analysis in the following.

  Essentially the LODS instruction at 0x00413A2B loads a double word (4 bytes) from the memory word pointed by ESI to EAX, and STOS does the inverse. When the string copy finishes, the LODS (STOS) instruction advances the ESI (EDI) instruction by 4. The next two instructions following the LODS instruction perform a very simple decoding operation, it uses EDX as the decoding key and applies XOR and SUB operations to decode the data.

  The loop ends when the EDI register is equal to the value of EBP. If you observe the values of EBP and EDI registers in the register pane, you will find that this decoding function is essentially decoding the region from 0x00413A40 to 0x00413BAC.

  Set a breakpoint at 0x00413A35 (or F4 to it), you can complete and step out of the loop. To view the effects of this decoding function, compare Figure 4 and Figure 5. You can see that before decoding, the instruction at 0x00413A40 is an IRET (interrupt return) instruction and after the decoding, it becomes the INT 2D instruction!

 Figure 4: Region 0x00413A40 to 0x00413BAC (before decoding)


 Figure 5: Region 0x00413A40 to 0x00413BAC (after decoding)


 Now let's right click on 0x00413A2B and select "Label" and we can mark the function as "basicEncoding". (This is essentially to declare 0x00413A2B as the entry address of function "BasicEncoding"). Later, whenever this address shows in the code pane, we will see this mnemonic for this address. This will facilitate our analysis work greatly.

5. Analysis of Code Beginning at 0x00410000

Function 0x00410000 first clears the ESI/EDI growing direction and immediately calls function 0x00413A18. At 0x00413A18, it again plays the trick of INT 2D. If the malware analyzer or binary debugger does not handle by the byte scission properly, the stack contents will not be right and the control flow will not be right (see Tutorials 3,4,5 for more details of INT 2D).

In summary,  when the function returns to 0x00413BED, the EBP should have been set up property. Its value should be 0x00413A40.

6. Analysis of Code Beginning at 0x00413A40

 We now delve into the instruction CALL EBP (0x00413A40). Figure 6 shows the function body of 0x00413A40. It begins with an INT 2D instruction (which is continued with a RET instruction). Clearly, in regular/non-debugged setting, when EAX=1 (see Tutorial 4), the byte instruction RET should be skipped and the execution should continue.

Figure 6: Another Decoding Function

Challenge of the Day

 The major bulk of the function is a multiple level nested loop which decodes and overwrites (a part) of the code segment. Now here comes our challenge of the day.

(1) How do you get out of the loop? [hint: the IMM debugger has generously plotted the loop structure (each loop is denoted using the solid lines on the left). Place a breakpoint at the first instruction out of the loop - look at 0x00413B1C]

(2) Which part of the code/stack has been modified? What are the starting and ending addresses? [Hint: look at the instructions that modify RAM, e.g., the instruction at 0x00413A6F, 0x00413A8D, 0x00413B0E.