- Understand hardware breakpoint
- Understand vectored/structured exception handling
- Understand the tricks that interrupt module loading
- Operating Systems.
- Computer Security.
- Programming Language Principles.
- Assembly Language.
Starling is a bird that steals nests of other birds. In this tutorial, you will look at a "starling" technique used by Max++ to run its own malicious code using the "body" of another benign module named "lz32.dll".
2. Lab Configuration
You can either continue from Tutorial 10, or follow the instructions below to set up the lab. Refer to Tutorial 1 and Tutorial 4 for setting up VBOX instances and WinDbg. We will continue to analyze the function starting at 0x4014F9.
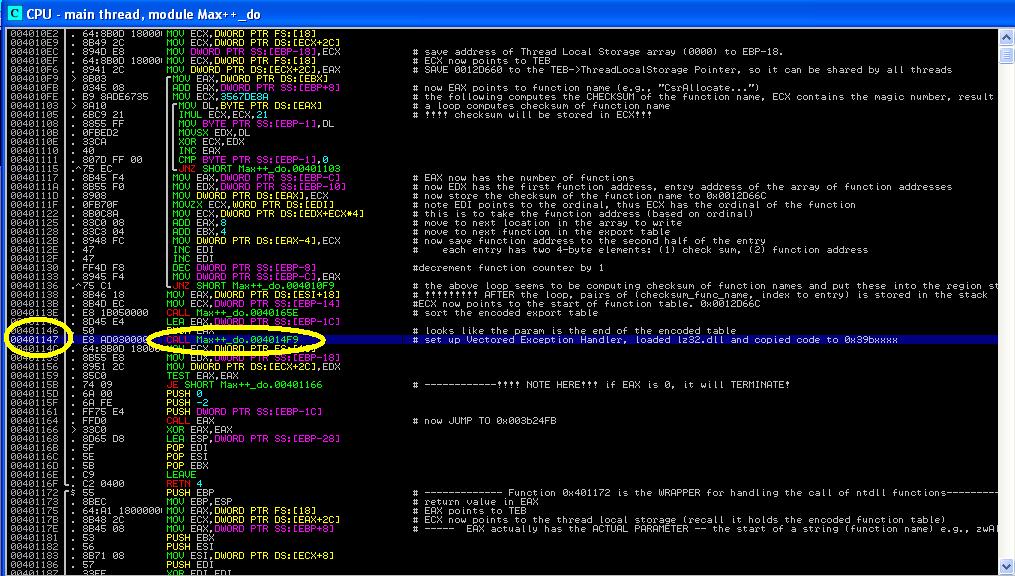 |
| Figure 1. Function 0x4014F9 to Analyze |
(1) Clear all hardware breakpoints.
(2) In code pane, right click and go to expression "0x4014F9"
(3) right click and then "breakpoints -> hardware, on execution"
(4) Press F9 to run to 0x4014F9
(4) If you see a lot of DB instructions, select them and right click -> "During next analysis treat them as Command".
(5) Restart Max++ and run to 0x4014F9 again. Select the instructions (about 1 screen) below 0x4014F9, right click -> Analysis-> Analyze Code. You should be able to see all loops now identified by IMM.
3. Background
Before we get to the interesting point, we will quickly go through the code before where the Max++ malware sets up a hardware breakpoint. We leave most of the analysis details to you and summarize the functionality of the these code snippets directly.
3.1 Revisit of zwAllocateVirtualMemory
Recall that in Tutorial 10, we showed you the trick how Max++ can invoke ntdll system calls without the use of export table. At 0x00401157 it calls 0x004136BF, which does a binary search in the encoded export table and then it jumps to the entry address of zwAllocateVirtualMemory. Now the interesting point is: what are the parameters of the call?
 |
| Figure 2. Stack Contents |
According to [1], zwAllocateVirtualMemory has 6 parameters, as shown in the following:
NTSTATUS ZwAllocateVirtualMemory(
  __in     HANDLE ProcessHandle,
  __inout  PVOID *BaseAddress,
  __in     ULONG_PTR ZeroBits,
  __inout  PSIZE_T RegionSize,
  __in     ULONG AllocationType,
  __in     ULONG Protect
);
The first parameter is the handle to a process within the address space of which a piece of memory will be allocated. Here, its value is 0xFFFF (-1) [see Figure 2], which means the current process. The second parameter (baseAddress) points to the memory word which will hold the base address of the newly allocated memory (note its type is inout). The last parameter, Protect, its value is 0x0040 [see the 5th word in Figure 2]. From the documentation in [1], we know that the constant values for "Protect" is defined in ntifs.h, or a simple Google search of "#define PAGE_NOACCESS" leads us to the header file directly. [NOTE: always use virtual machine to perform such Google search. Websites publishing windows source code are often loaded with malicious attack code such as drive-by download!] We now know that 0x40 is the value of macro "PAGE_EXECUTE_READWRITE". Did you smell something suspicious? The newly allocated memory will be executable!
So far so good, we know that the beginning address of the new VM (virtual memory) will be stored in 0x0012D648. Right click on 0x0012D648 in the stack and select "Follow in Dump", step over (F8) the call 0x4136BF instruction at 0x00401157, you will notice that the newly allocated memory starts at 0x00003A00. [This value could vary between runs, even if you are using the same VBox instance]
3.2 Another Layer of Self-Extraction
Immediately following the zwAllocateVirtualMemory is a big two-layer nested loop (shown in Figure 3), starting from 0x00401567. Its purpose is to extract a section of data from Max++'s address space and copy it into the newly allocated VM starting at 0x00003A00 (the address may vary at run-time). We leave the details of the analysis to you and the following are some questions for you:
(1) Where is the data from?
(2) What is the size of the code copied into 0x00003A00?
(3) How do you jump out of the two layer nested loop?
 |
| Figure 3. Self-Extraction Again |
3.3. First section of 0x4012AB.
If you successfully get out of the 2-layer loop of section 3.2, you would soon reach function 0x4012AB. This is an important function. Figure 4 shows the first part of this section. Now we get to the first interesting call at 0x4012C9 (see Figure 4). It calls function 0x004137D1. By tracing into the function, you will soon notice that it is actually a call to ntdll function RtlNtImageNtHeader, which takes a module address as a parameter, and returns a pointer to IMAGE_NT_HEADERS structure. Read Tutorial 8 (PE header) for the detailed analysis of the data structure.
So what is the input parameter of RtlNtImageHeader? It's 0x003A0000 (the newly allocated memory). The return value (pointer to IMAGE_NT_HEADER) is also 0x003A0000. You can verify that it is indeed a pointer to IMAGE_NT_HEADER.
 |
| Figure 4. RtlImageNtHeader |
 |
| Figure 5. PE Header of the newly extracted binary executable |
4. The Starlings Trick: Take the Address Space of Another Module
Starlings are well known for stealing other birds' nest. In the following, we show a highly skillful technique employed by Max++, which simulates starlings to load the new executable starting from 0x003A0000 using the address space of another module. The road map is follows:
- add an exception handler at 0x413657 (all interrupts, including hardware breakpoints, will trigger the code at 0x413657),
- set a hardware exception at 0x7C90D500,
- load a DLL file named "lz32.dll",
- while the OS kernel is loading lz32.dll, the hardware exception triggers the code of 0x413657. It finishes the job of resetting the module address range to 0x003A0000 and avoid the loading of the real code from the "lz32.dll" file into the module's address space.
4.1 Add Vectored Exception Handler
At 0x4012E4 (see Figure 6), the malware calls 0x413776 (again, it's a trick to avoid the use of export table to call ntdll functions) to invoke RtlAddVectoredExceptionHandler. For an introduction of Structured Exception Handlers, see Tutorial 3. It installs 0x00413657 as the first handler for all exceptions, including hardware breakpoints, any interrupt will trigger the code at 0x00413657 first.
 |
| Figure 6. Set up Vectored Exception Handler |
Challenge 2 of the Day: (1) show the parameters of the RtlAddVectoredException; (2) If we run Max++ on a different computer, would the value of exception handler entry take a value other than 0x00413657?
Challenge 3 of the Day: (1) at 0x401314, Max++ calls 0x4136E4. Analyze which system function it is actually invoking. (2) At 0x401346 (call 0x413811), it is actually calling RtlPushFrame. Explain its purpose. (3) At 0x00401360 (call 0x413701), it is actually calling zwMapViewOfSection. Explain its purpose. (4) Combining (1), (2), and (3), what do you think the malware is trying to do?
4.2 Set Hardware Breakpoint 0x7C90D500
We now list some details of the second step. The key is the function 0x413736 as shown in Figure 7. It is essentially a call to zwSetContextThread. Its information is not officially available from Microsoft, but doing a little web search you will be able to find that it takes two parameters:
IN HANDLE processHandle (value is 0xFFFF as shown in the stack pane of Figure 7)
INOUT PCONTEXT pContext (value is 0x0012D028 as shown in Figure 7)
 |
| Figure 7. zwSetContextThread |
//for x86
typedef struct _CONTEXT {
DWORD ContextFlags;
...
DWORD Dr0;
DWORD Dr1;
DWORD Dr2;
DWORD Dr3;
DWORD Dr6;
DWORD Dr7;
...
FLOATING_SAVE_AREA FloatSave;
/...
} CONTEXT;
typedef struct _CONTEXT {
DWORD ContextFlags;
...
DWORD Dr0;
DWORD Dr1;
DWORD Dr2;
DWORD Dr3;
DWORD Dr6;
DWORD Dr7;
...
FLOATING_SAVE_AREA FloatSave;
/...
} CONTEXT;
 |
| Figure 8. CONTEXT structure contents at 0x0012D028 |
Challenge 3 of the Day: (1) Explain the value 0x00010010 of the ContextFlags, what does it mean? (2) Find out 0x7C90D500, is it an entry address (or somewhere inside) of a system function?
4.3 Load lz32.dll
The next step is to load lz32.dll. Figure 9 shows the details (look at the comments area). It basically consists of two steps: (1) construct a unicode string "lz32.dll" and then (2) load the "lz32.dll" as a module. Tackle the following questions:
Challenge 4 of the day: (1) Explain the logic of function 0x004137EF, (2) Explain the logic of 0x41385D.
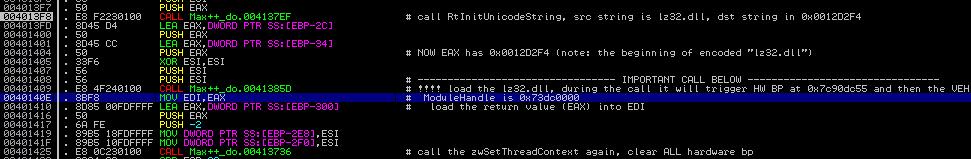 |
| Figure 9. Load lz32.dll |
4.4 Interrupting the LdrLoadDll procedure
Note that "lz32.dll" is not malicious, it IS the victim! When the dll file is loaded, the loading procedure will actually be interrupted by Max++. Recall that Max++ has already set the interrupt handler at 0x00413657.
Now set a software breakpoint at 0x00413657, and also a breakpoint at 0x0040140E (right after the loading of lz32.dll). You going to get the most tricky part of the analysis:
Challenge 5 of the day: Explain why isn't 0x00413657 never hit? Find a way to stop at 0x00413657.
The correct way of hitting the 0x00413657:
(1)goto 0x00413657 and set a SOFTWARE BREAKPOINT on it (by pressing F2).
(2) Press SHIFT+F9 (think about what is the meaning of SHIFT+F9).
(3) You might be hitting 0x7C90D5000 (think about why you are hitting it in IMM? -- because it's a hardware breakpoint set by Max++. IMM stops at it even though it's not a HW breakpoint set inside IMM).
(4) Simply SHIFT+F9 again and you will hit 0x00413657. Now you can start your analysis of the exception handler.
Then the analysis is going to be quite some work, in the following please find some hints:
(1) The code at 0x00413657 is essentially an exception handler. Check out [3] for the calling convention (how the parameters are passed) for exception handlers. You will notice that the code is reading the exception record and tell if it is of its special interest. If it's not the hardware breakpoint exception (more exactly single_step_trap), the handler simply passes the exception to the next handler in the chain.
(2) Once it is identified to be a hardware breakpoint, the handler does some writing into the memory. For example, it is writing value "0x003A0000" to some kernel data structures (related to a module). Think about why?
(3) The handler sets the thread Context again to set the EIP register so that it does not return the 0x7Cxx (ntdll) function being called. The result? the actual binary code of lz32.dll is not loaded. Thus, the 0x003A0000 code stays there and is executed when the module "lz32.dll" is started.
Challenge 6 of the day: analyze each line starting from 0x00413657 and verify if the above statement is true.
References
1. Microsoft, "zwAllocateVirtualMemory Routine", available at http://msdn.microsoft.com/en-us/library/windows/hardware/ff566416(v=vs.85).aspx.
2. Microsoft, "Context Structure", available at http://msdn.microsoft.com/en-us/library/windows/desktop/ms679284(v=vs.85).aspx.
3. M. Pietrek, "A Crash Course on the Depth of Win32Tm Structured Exception Handling," Microsoft System Journal, 1997/01. Available at http://www.microsoft.com/msj/0197/exception/exception.aspxhttp://www.microsoft.com/msj/0197/exception/exception.aspx.
Great thoughts you got there, believe I may possibly try just some of it throughout my daily life.
ReplyDeleteFunction Point Estimation Training
This is great information, thanks’ for share!
ReplyDeleteConstructive apps encourage creativity through high cognitive engagement. Computer training long island
ReplyDeleteNice blog!!!!!!!.
ReplyDeleteReverseEngineering
you are actually a just right webmaster. The
ReplyDeletesite loading velocity is amazing. It kind of feels that you’re doing
any unique trick. Also, The contents are masterwork. you
have done a excellent job on this topic!
Here is the link of Latest Designer:
https://softserialskey.com/proteus-design-suite-professional-crack/
Download It Free Now!
Great Article
ReplyDeleteCyber Security Projects
Networking Security Projects
JavaScript Training in Chennai
JavaScript Training in Chennai
The Angular Training covers a wide range of topics including Components, Angular Directives, Angular Services, Pipes, security fundamentals, Routing, and Angular programmability. The new Angular TRaining will lay the foundation you need to specialise in Single Page Application developer. Angular Training
Thanks for a great read
ReplyDelete